Annual Report 2018

Reporting

Balance Sheet Analysis

At 31 December (CHF in millions)

2018

2017

Variance

in %

Assets


Cash and cash equivalents

499

418

81

19

Net financing receivables

4,807

4,562

245

5

     Personal loans

1,885

1,782

103

6

     Auto leases and loans

1,974

1,942

32

2

     Credit cards

940

833

107

13

     Other

8

5

3

67

Financial investments

11

12

– 1

– 9

Other assets

124

108

16

15

Total assets

5,440

5,099

341

7

Liabilities and equity


Deposits and debt

4,325

4,048

277

7

     Deposits

2,827

2,627

200

8

     Debt

1,498

1,421

77

5

Other liabilities

182

166

16

10

Total liabilities

4,507

4,214

293

7

Shareholders’ equity

933

885

48

5

Total liabilities and shareholders’ equity

5,440

5,099

341

7

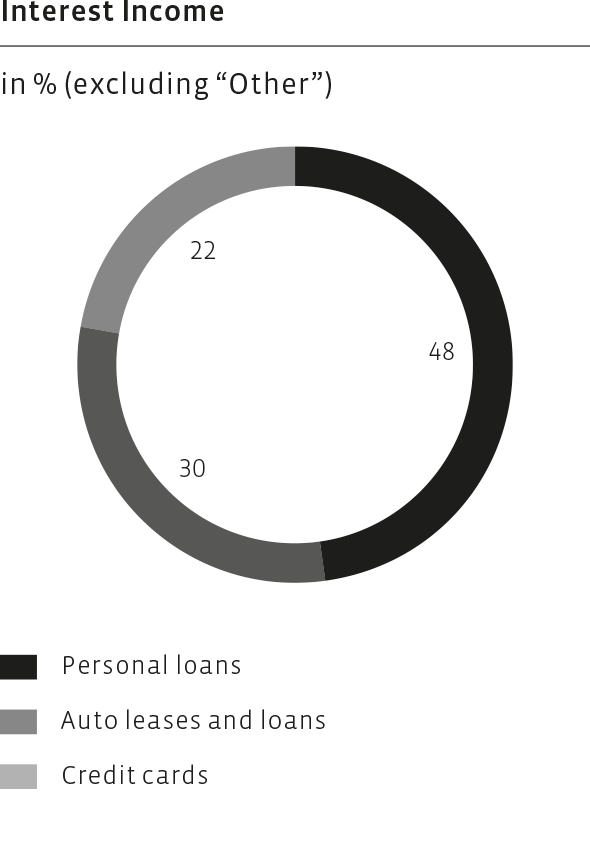
Net financing receivables amounted to CHF 4,807 million, an increase of 5% or CHF 245 million, compared to year-end 2017. At the end of 2018, the Group’s personal loans accounted for 39% (2017: 39%), auto leases and loans made up for 41% (2017: 43%), and the credit cards business accounted for 20% (2017: 18%) of the net financing receivables. 

As of 31 December 2018, net financing receivables from personal loans were 6% higher at CHF 1,885 million compared to year-end 2017. Auto leases and loans grew by 2% to CHF 1,974 million compared to CHF 1,942 million at the end of 2017. Credit cards increased by 13% from CHF 833 million to CHF 940 million in the reporting period. Other net financing receiv­ables of CHF 8 million (FY 2017: CHF 5 million) included the Swissbilling business which was acquired in February 2017.

Funding

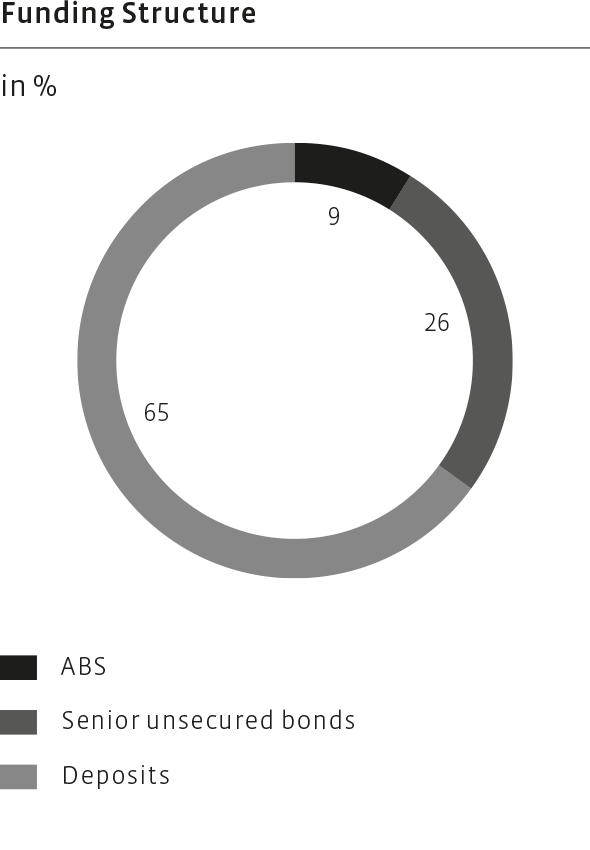
The Group maintained its funding diversification throughout 2018. The deposit base increased by 8% from CHF 2,627 million at 31 December 2017 to CHF 2,827 million at 31 December 2018. The institutional deposit base was 10% higher at CHF 1,868 million while retail deposits grew by 4% to CHF 959 million. The Group’s non-deposit debt increased by 5% from CHF 1,421 million as at 31 December 2017 to CHF 1,498 million as at 31 December 2018, mainly due to the issuance of two senior unsecured bonds. In February 2018, the Group raised CHF 50 million through a Floating Rate Note Private Placement with a two-year maturity (2018–2020). In May 2018, an additional unsecured bond of CHF 125 million with a maturity of 8 years (2018–2026) was placed in the market. 

Equity


Total shareholders’ equity increased by CHF 48 million from CHF 885 million to CHF 933 million at year-end 2018. The increase was mainly driven by the net income of CHF 154.1 million and was partially offset by the dividend payment for the business year 2017 of CHF 100.1 million in April 2018.

Capital Position

At 31 December (CHF in millions)

2018

2017

Variance

in %

Risk-weighted assets

4,346

4,114

232

6

Tier 1 capital

834

790

44

6

Tier 1 ratio (in %)

19.2%

19.2%


Risk-weighted assets increased by 6% to CHF 4,346 million as per 31 December 2018 compared to CHF 4,114 million as per 31 December 2017. This increase was largely in line with the development of net financing receivables. The Tier 1 capital increased by CHF 44 million, or 6%, to CHF 834 million mainly as a result of the statutory net income generated in 2018 adjusted for the expected future dividend payment. This resulted in a Tier 1 capital ratio of 19.2% as per 31 December 2018 which was significantly above the regulatory requirement of 11.2% and the Group’s minimum target of 18.0%.

Profit and Loss Analysis

For the years ended 31 December (CHF in millions)

2018

2017

Variance

in %

Interest income

330.0

308.3

21.7

7

Interest expense

20.8

– 24.7

– 3.9

– 16

Net interest income

309.2

283.6

25.6

9

Commission and fee income

129.6

112.7

16.9

15

Net revenues

438.8

396.3

42.5

11

Provision for losses on financing receivables

50.1

– 45.1

5.0

11

Compensation and benefits

105.8

– 97.7

8.1

8

General and administrative expenses

87.2

– 70.3

16.9

24

Total operating expenses

193.0

– 167.9

25.1

15

Income before income taxes

195.7

183.3

12.4

7

Income tax expense

41.6

– 38.8

2.8

7

Net income

154.1

144.5

9.6

7


Other comprehensive income / (loss )

6.3

18.0

24.3

n/a

Comprehensive income

147.8

162.5

– 14.7

– 9

Interest Income

For the years ended 31 December (CHF in millions)

2018

2017

Variance

in %

Personal loans

161.3

167.1

– 5.8

– 3

Auto leases and loans

98.4

83.8

14.6

17

Credit cards

71.7

60.5

11.2

19

Other

1.5

– 3.1

1.6

51

Total

330.0

308.3

21.7

7

Overall, the contribution of personal loans to interest income reduced from 54% to 48%, the relative weight of auto leases and loans increased to 30% from 27% whilst the weight of credit cards rose to 22% compared to 19% in the prior year’s period.

Total interest income increased by 7%, or CHF 21.7 million, to CHF 330.0 million in 2018. Interest income from personal loans decreased by CHF 5.8 million, or 3%, to CHF 161.3 million, following the introduction of the new rate cap as of 1 July 2016 and subsequent reduction in pricing. Consequently, the yield declined to 8.6% from 9.3% in the reporting period.

Interest income from the Group’s auto leases and loans increased by CHF 14.6 million, or 17%, from CHF 83.8 million to CHF 98.4 million in 2018, mainly due to the acquisition of EFL in 2017. The yield increased slighly to 5.0% compared to 4.9% in the previous year. Interest income from credit cards increased by CHF 11.2 million, or 19%, to CHF 71.7 million in 2018. The increase was primarily due to higher levels of credit card receivables as a result of an increase in credit card volumes and an increase in the number of credit cards issued. The yield increased slightly to 8.0%. Other interest income included CHF 1.5 million expenses from the negative interest rate on the cash held with the Swiss National Bank and other institutions.

Cost of Funds

For the years ended 31 December (CHF in millions)

2018

2017

Variance

in %

Interest expense on ABS

1.8

1.8

Interest expense on deposits

12.6

13.2

– 0.6

– 5

Interest expense on debt

6.4

9.7

– 3.3

– 34

Total

20.8

24.7

– 3.9

– 16

The Group’s overall cost of funds decreased by CHF 3.9 million, or 16%, from CHF 24.7 million in 2017 to CHF 20.8 million in 2018. Interest expense on auto lease asset-backed securities (ABS) remained unchanged at CHF 1.8 million. Interest expense on deposits decreased by 5% to CHF 12.6 million as a result of favourable market conditions and repricing of the deposit portfolio at lower rates, despite a 8% increase of the portfolio. The total interest expense on non-deposit debt decreased by CHF 3.3 million, or 34%, from CHF 9.7 million to CHF 6.4 million in 2018. The main reason was the replacement of bank loans (2017/2018 maturities) and of a bond maturity in November 2017 with several unsecured bond issuances at low coupons over the last two years.

Commission and Fee Income

For the years ended 31 December (CHF in millions)

2018

2017

Variance

in %

Insurance

20.5

23.0

– 2.5

– 11

Credit cards

92.6

75.0

17.6

23

Loans and leases

13.4

11.8

1.6

14

Other

3.2

2.9

0.3

10

Total

129.6

112.7

16.9

15

The Group’s commission and fee income increased by CHF 16.9 million, or 15%, from CHF 112.7 million in 2017 to CHF 129.6 million. The increase was mainly due to higher fee income on credit cards of 23% or CHF 17.6 million. The reduction in domestic interchange fees that came into effect on 1 August 2017 was more than compensated by portfolio growth and product initiatives. "Other" includes fee income from Swissbilling.

Insurance income, mainly revenues from payment protection insurance products, declined by CHF 2.5 million, or 11% to CHF 20.5 million following the termination of a partnership agreement. The increase in fees from loans and leases of 1.6 million to CHF 13.4 million was mainly attributable to an US GAAP accounting change.

Provision for Losses on Financing Receivables

For the years ended 31 December (CHF in millions)

2018

2017

Variance

in %

Provision for losses on personal loans

29.6

26.7

2.9

11

Provision for losses on auto leases and loans

11.2

8.8

2.4

27

Provision for losses on credit cards

8.4

9.0

– 0.6

– 7

Provision for losses on other

1.0

0.6

0.4

65

Total

50.1

45.1

5.0

11

The Group’s provision for losses on financing receivables increased by CHF 5.0 million or 11% to CHF 50.1 million in 2018, compared to CHF 45.1 million in 2017. This is predominantly driven by growth in the financing receivables across port­folios that typically leads to higher allowances for losses and consequently to write-offs. Provision for losses on personal loans increased by CHF 2.9 million to CHF 29.6 million in 2018. Provision for losses on the auto leases and loans increased by CHF 2.4 million from CHF 8.8 million in 2017 to CHF 11.2 million in 2018. Provision for losses on cards of CHF 8.4 million in 2018 decreased by CHF 0.6 million compared to 2017. Execution of the recovery strategies in 2018 over-compensated the effect of growth of financing receivables in this portfolio. The Group’s loss rate for the year 2018 was 1.1% of financing receivables compared to 1.0% in 2017. Delinquency metrics of 30 days past due (1.8% as of 31 December 2018) and non-performing loans (0.4% as of 31 December 2018) remained at the same level as in 2017.

Compensation and Benefits

For the years ended 31 December (CHF in millions)

2018

2017

Variance

in %

Compensation and benefits

105.8

97.7

8.1

8

The Group’s compensation and benefits expenses increased by CHF 8.1 million, or 8%, to CHF 105.8 million. The increase in cost was primarily driven by a higher number of headcount after the acquisitions of Swissbilling and EFL Autoleasing AG.

The average number of employees (full-time equivalent – FTE) of the Group was 759 in 2018 compared to 701 (excluding acquisitions) in the corresponding prior-year period. The average cost per FTE of TCHF 140 in 2018 was stable compared to 2017.

General and Administrative Expenses

For the years ended 31 December (CHF in millions)

2018

2017

Variance

in %

Professional services

18.6

11.4

7.2

63

Marketing

8.5

6.1

2.4

40

Collection fees

10.9

5.8

5.1

88

Postage and stationery

9.9

9.3

0.6

6

Rental expense under operating leases

4.9

4.7

0.2

4

Information technology

24.9

23.6

1.3

6

Depreciation and amortisation

13.0

8.7

4.3

49

Other

3.5

0.7

– 4.2

n/a

Total

87.2

70.3

16.9

24

The Group’s general and administrative expenses increased by CHF 16.9 million, or 24%, from CHF 70.3 million to CHF 87.2 million in the year of 2018. Costs from professional services of CHF 18.6 million increased by 63% or CHF 7.2 million, mainly due to business development and strategic innovation projects. Marketing expenses were 40% or CHF 2.4 million higher due to the adoption of ASC 606 revenue recognition standard as of 1 January 2018 which resulted in a reclassification of CHF 3.4 million of revenues from marketing.

Collection fees increased by 88%, or CHF 5.1 million, to CHF 10.9 million due to increased activities with third party collection services and the adoption of ASC 606 revenue recognition standard as of 1 January 2018 which resulted in a reclassification of CHF 3.2 million of revenues from collection costs to commission and fee income. Costs for postage and stationery increased slightly from CHF 9.3 million to CHF 9.9 million. Rental expenses slightly increased from CHF 4.7 million to CHF 4.9 million in 2018. Information technology costs of CHF 24.9 million were 6% higher. Depreciation and amortisation was 49% higher, mainly driven by a CHF 2.8 million increase due to investments in IT and projects. "Other" costs decreased by CHF 4.2 million, primarily driven by lower pension costs.

The cost/income ratio was 44.0% in 2018 compared to 42.4% in 2017.

Income Tax Expense

The Group’s income tax expense increased by CHF 2.8 million, or 7%, to CHF 41.6 million in 2018 as a result of the 7% ­higher income before taxes. The Group’s effective tax rate was 21% which was in line with the statutory tax rate resulting from the combination of federal, cantonal and communal corporation taxes in Switzerland.

The numbers published in the tables above are in Swiss francs and rounded, therefore rounding differences can occur.

Outlook

Outlook and Guidance for 2019

Assuming no major change in the current economic environment, the Group is expecting earnings per share between CHF 5.40 and CHF 5.70 for the financial year 2019. Continued growth in credit cards should offset the remaining impact of the rate cap on interest income in the personal loans business. The continued cost discipline is expected to benefit from efficiency gains which will be offset by further investments in digitisation and product development. Loss performance is expected to be in line with prior years.

The Group’s financial mid-term targets are as follows:

  • Average return on shareholders’ equity (ROE) of at least 15%;
  • Consolidated Tier-1 capital ratio of minimum 18%; and
  • Ordinary dividend payout ratio between 60% and 70% of net income.