Annual Report 2017

Reporting

Balance Sheet Analysis

At 31 December (CHF in millions)

2017

2016

Variance

in %

Assets


Cash and cash equivalents

418

669

– 251

– 38

Net financing receivables

4,562

4,073

489

12

     Personal loans

1,782

1,720

62

4

     Auto leases and loans

1,942

1,641

301

18

     Credit cards

833

711

122

17

     Other

5

5

Financial investments

12

12

Other assets

108

104

4

4

Total assets

5,099

4,857

242

5

Liabilities and equity


Deposits and debt

4,048

3,874

174

4

     Deposits

2,627

2,355

272

12

     Debt

1,421

1,520

– 99

– 7

Other liabilities

166

135

31

23

Total liabilities

4,214

4,009

205

5

Shareholders' equity

885

848

37

4

Total liabilities and shareholders' equity

5,099

4,857

242

5


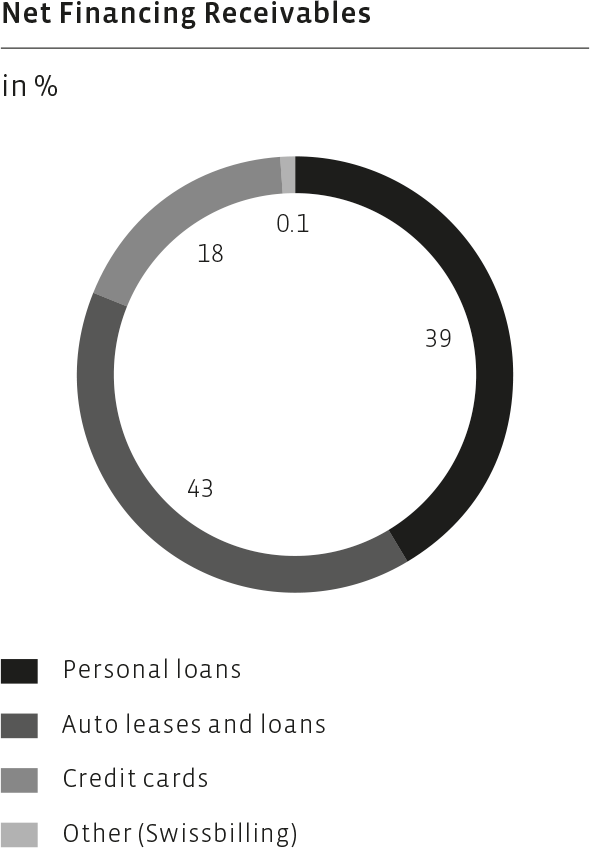
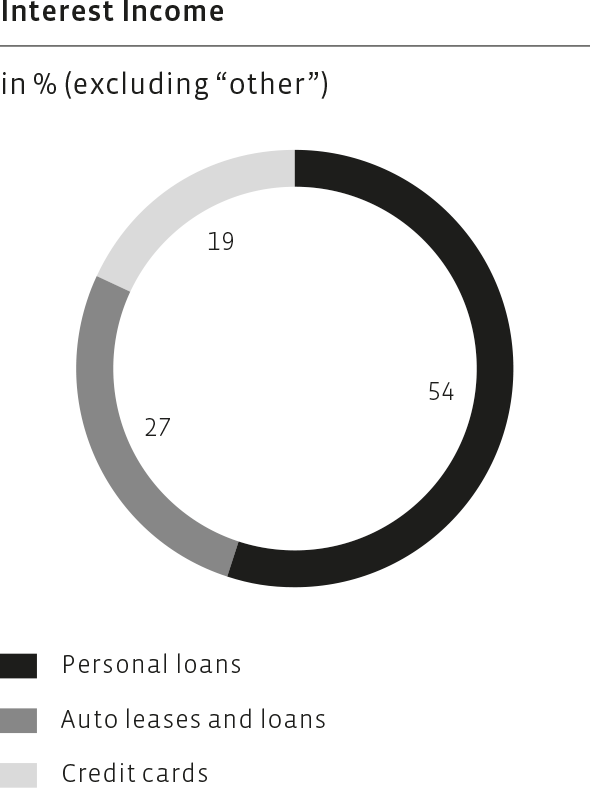
Net Financing Receivables

Net financing receivables amounted to CHF 4,562 million as at 31 December 2017, which was an increase of CHF 489 million or 12% compared to CHF 4,073 million as at 31 December 2016. Acquisitions and refinancing transactions contributed CHF 327 million to the increase while organic growth contributed CHF 162 million. At the end of 2017, the Group’s personal loans accounted for 39% (2016: 42%), auto leases and loans made up for 43% (2016: 40%), and the credit cards business accounted for 18% (2016: 18%) of the net financing receivables.

Receivables from personal loans increased by 4% to CHF 1,782 million including receivables from the refinancing transaction (CHF 44 million) with eny Finance. Auto leases and loans receivables grew by 18% to CHF 1,942 million at 31 December 2017 compared to CHF 1,641 million at year-end 2016, mainly driven by the acquisition of EFL Autoleasing (CHF 278 million). In 2017, credit cards receivables increased by 17% from CHF 711 million at year-end 2016 to CHF 833 million at year-end 2017. Other net financing receivables of CHF 5 million included the Swissbilling business which was acquired in February 2017.
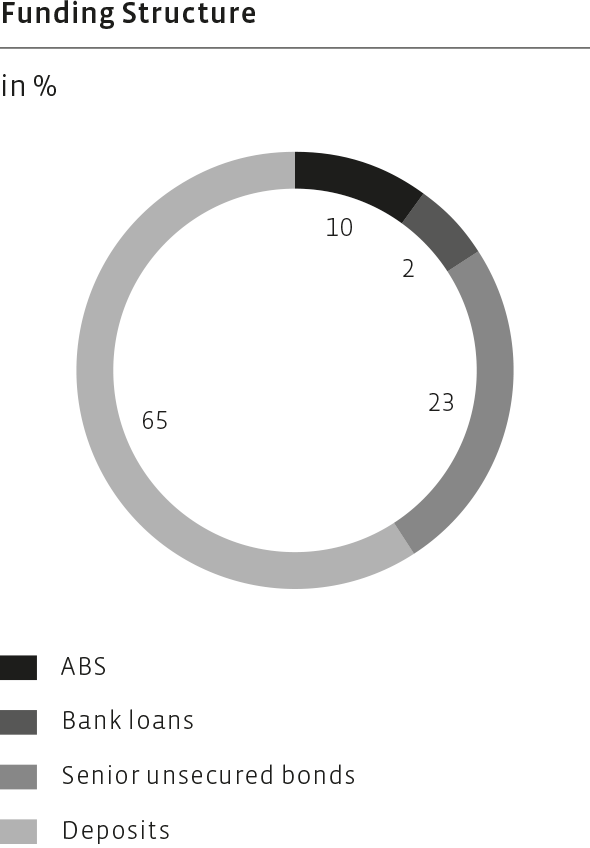
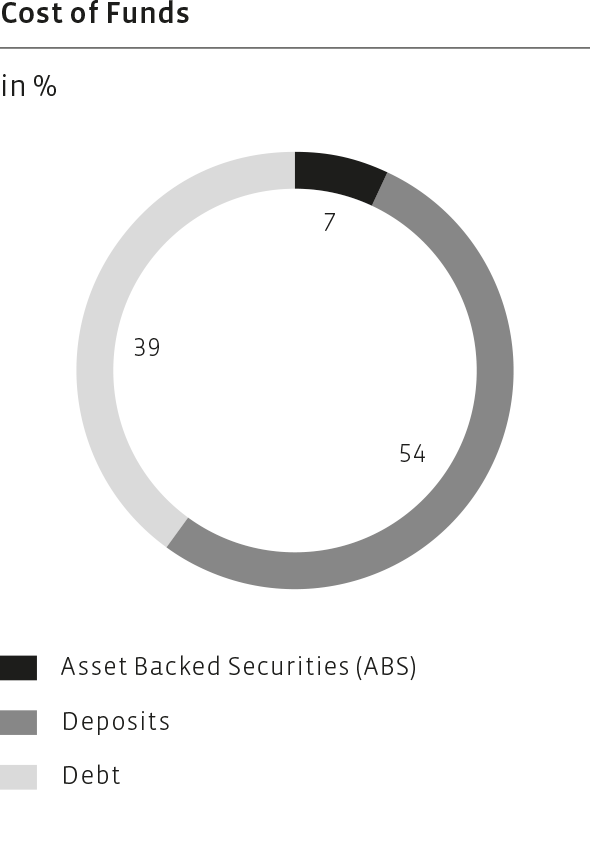
Funding

The Group maintained its funding diversification throughout 2017. Deposits grew by 12% from CHF 2,355 million as at 31 December 2016 to CHF 2,627 million as at 31 December 2017 in line with the higher receivable base. While the institutional deposit base was 20% higher at CHF 1,705 million, retail deposits slightly declined by 2% to CHF 922 million. The Group’s debt (excluding deposits) decreased by 7% from CHF 1,520 million as at 31 December 2016 to CHF 1,421 million as at 31 December 2017. This was primarily driven by a CHF 200 million reduction of bank loans and the maturity of a CHF 250 million senior unsecured bond partially offset by the issuance of two senior unsecured bonds. The Group returned to the capital markets in June 2017 and raised CHF 150 million through an unsecured bond with an eight year maturity (2017–2025). In October 2017, an additional unsecured bond of CHF 200 million with a maturity of 6.5 years (2017–2024) was placed in the market. Overall, the focus was on extending the overall maturity profile of the book and limiting future maturity concentration whilst further optimising the funding costs.

Shareholders' Equity


Total shareholders’ equity increased by CHF 37 million from CHF 848 million at year-end 2016 to CHF 885 million at 31 December 2017. The increase was mainly driven by the current year net income of CHF 144.5 million and was partially offset by the dividend payment for the business year 2016 of CHF 125.5 million in April 2017.
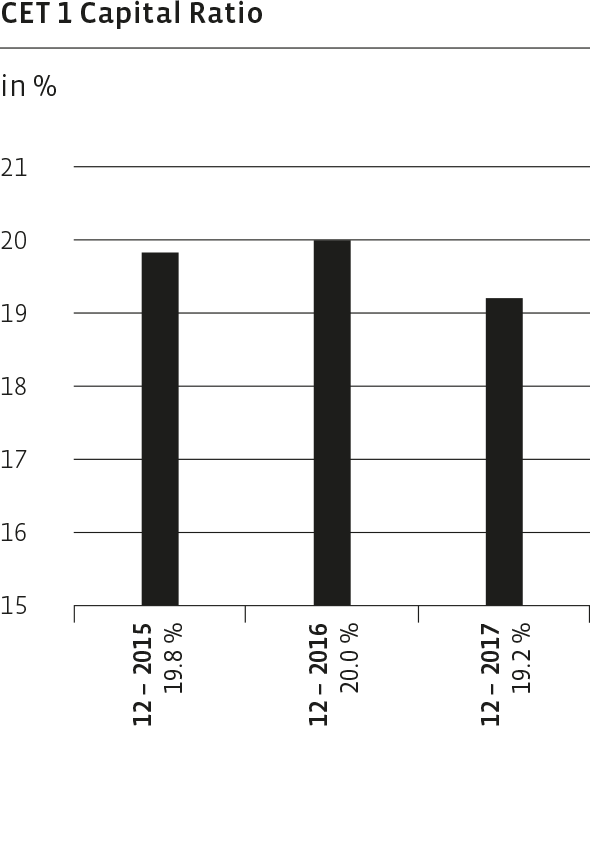
Capital Position

At 31 December (CHF in millions)

2017

2016

Variance

in %

Risk-weighted assets

4,114

3,758

356

9

Tier 1 capital

790

753

37

5

Tier 1 ratio (in %)

19.2%

20.0%


Risk-weighted assets increased by 9% to CHF 4,114 million as per 31 December 2017 compared to CHF 3,758 million as per 31 December 2016. This increase was in line with the development of net financing receivables. The Tier 1 capital increased by CHF 37 million, or 5 %, to CHF 790 million mainly as a result of the net income generated in 2017 adjusted for expected future ordinary dividend payments. This resulted in a Tier 1 ratio of 19.2% as per 31 December 2017 which was significantly above the regulatory requirement of 11.2% and the Group’s minimum target of 18.0%.

Profit and Loss Analysis

For the years ended 31 December (CHF in millions)

2017

2016

Variance

in %

Interest income

308.3

324.3

– 16.0

– 5

Interest expense

24.7

– 26.5

– 1.8

– 7

Net interest income

283.6

297.7

– 14.1

– 5

Commission and fee income

112.7

96.3

16.4

17

Net revenues

396.3

394.0

2.3

1

Provision for losses on financing receivables

45.1

– 44.6

0.5

1

Compensation and benefits

99.9

– 100.4

– 0.5

0

General and administrative expenses

68.0

– 67.1

0.9

1

Total operating expenses

167.9

– 167.5

0.4

0

Income before income taxes

183.3

181.9

1.4

1

Income tax expense

38.8

– 38.2

0.6

2

Net income

144.5

143.7

0.8

1


Other comprehensive income / (loss)

18.0

– 0.1

18.1

n/a

Comprehensive income

162.5

143.6

18.9

13

Interest Income

For the years ended 31 December (CHF in millions)

2017

2016

Variance

in %

Personal loans

167.1

191.3

– 24.2

– 13

Auto leases and loans

83.8

83.5

0.3

0

Credit cards

60.5

51.6

8.9

17

Other

3.1

– 2.3

– 0.8

35

Total

308.3

324.3

– 16.0

– 5


Personal loans accounted for 54% and 59% of interest income in the years ended 31 December 2017 and 2016, respec­tively. Auto leases and loans accounted for 27% and 25% of interest income in 2017 and 2016, respectively. Credit cards accounted for 19% and 16% of interest income in the years ended 31 December 2017 and 2016, respectively.

The Group’s interest income declined by CHF 16.0 million, or 5%, from CHF 324.3 million in 2016 to CHF 308.3 million in 2017. Other interest income included CHF 2.9 million expenses from the negative interest rate on the cash held with the Swiss National Bank and other institutions. Interest income from personal loans decreased by CHF 24.2 million, or 13%, from CHF 191.3 million in 2016 to CHF 167.1 million in 2017 following the implementation of the interest rate caps in July 2016. Consequently, the yield reduced to 9.3% from 10.7% in the previous year. Interest income from the Group’s auto leases and loans business increased by CHF 0.3 million to CHF 83.8 million in 2017. Revenues from the newly acquired EFL Autoleasing business were included for the month of December only with a 4.9% yield. Interest income from credit cards increased by CHF 8.9 million, or 17%, from CHF 51.6 million in 2016 to CHF 60.5 million in 2017. The increase was primarily due to higher levels of credit card receivables as a result of an increase in credit card volumes and a change to the interest rate in the Cumulus Mastercard programme. The yield increased slightly to 7.8%.

Cost of Funds

For the years ended 31 December (CHF in millions)

2017

2016

Variance

in %

Interest expense on ABS

1.8

2.2

– 0.4

– 18

Interest expense on deposits

13.2

15.0

– 1.8

– 12

Interest expense on debt

9.7

9.4

0.3

3

Total

24.7

26.5

– 1.8

– 7


The Group’s overall cost of funds decreased by CHF 1.8 million, or 7%, from CHF 26.5 million in 2016 to CHF 24.7 million in 2017. Interest expense on auto lease ABS decreased by 18% to CHF 1.8 million. The decrease was mainly due to the refinancing of an ABS in 2016 at more attractive conditions. Interest expense on deposits decreased by 12%, or CHF 1.8 million, to CHF 13.2 million as a result of favourable market conditions and natural repricing of the deposit portfolio at lower rates, despite a 12% increase of the portfolio. The total interest expense on debt increased by CHF 0.3 million, or 3%, from CHF 9.4 million in 2016 to CHF 9.7 million in 2017.

Commission and Fee Income

For the years ended 31 December (CHF in millions)

2017

2016

Variance

in %

Insurance

23.0

21.9

1.1

5

Credit cards

75.0

63.5

11.5

18

Loans and leases

11.8

10.6

1.2

11

Other

2.9

0.3

2.6

867

Total

112.7

96.3

16.4

17

The Group’s commission and fee income increased by CHF 16.4 million, or 17%, from CHF 96.3 million in 2016 to CHF 112.7 million in 2017. The increase was mainly due to an 18% increase, or CHF 11.5 million, in fee income on credit cards. The negative effect from the second reduction of the domestic interchange fee was more than compensated by the effect of the growing credit card portfolio. Insurance income, mainly revenues from payment protection insurance products, increased by CHF 1.1 million, or 5% to CHF 23.0 million as a result of higher profit share and a one-off gain. The increase in fees from loans and leases of 1.2 million to CHF 11.8 million was mainly attributable to fee changes. In 2017, the position “Other” includes the fee income from the newly incorporated Swissbilling.

Provision for Losses on Financing Receivables

For the years ended 31 December (CHF in millions)

2017

2016

Variance

in %

Provision for losses on personal loans

26.7

31.3

– 4.6

– 15

Provision for losses on auto leases and loans

8.8

6.4

2.4

38

Provision for losses on credit cards

9.0

6.8

2.2

32

Provision for losses on other

0.6

0.6

Total

45.1

44.6

0.5

1


The Group’s provision for losses on financing receivables increased by CHF 0.5 million or 1% to CHF 45.1 million in 2017, compared to CHF 44.6 million in 2016. Provision for losses on personal loans decreased by CHF 4.6 million to CHF 26.7 million in 2017, predominantly driven by lower write-offs as a consequence of market dynamics that changed with the implementation of the interest rate cap in 2016. On auto leases and loans the provision for losses increased by CHF 2.4 million from CHF 6.4 million in 2016 to CHF 8.8 million in 2017 following a shift between consumer and product segments. Higher write-offs on credit cards as a consequence of a growing portfolio lead to provision for losses of CHF 9.0 million in 2017, an increase of CHF 2.2 million compared to 2016. Overall, the Group’s loss rate in 2017 was 1.0% of financing receivables, a slight improvement compared to 2016 when the loss rate was reported at 1.1% of financing receivables. Delinquency metrics of 30 days past due (1.8% as of 31 December 2017) and non-performing loans (0.4% as of 31 December 2017) remained flat when compared to 2016.

Compensation and Benefits

For the years ended 31 December (CHF in millions)

2017

2016

Variance

in %

Compensation and benefits

99.9

100.4

– 0.5

0


The Group’s compensation and benefits decreased by CHF 0.5 million from 100.4 million in 2016 to CHF 99.9 million in 2017. The decrease was mainly attributable to lower pension costs of CHF 1.5 million driven by the implementation of a lower conversion rate partially offset by higher headcount following the acquisitions of EFL and Swissbilling.

The average number of employees (full-time equivalent – FTE) of Cembra Money Bank AG (excluding the two acquisitions) was 701 in 2017 compared to 705 in 2016. The average cost per FTE was TCHF 140 in 2017 and TCHF 142 in 2016.

General and Administrative Expenses

For the years ended 31 December (CHF in millions)

2017

2016

Variance

in %

Professional services

11.4

9.0

2.4

27

Marketing

6.1

6.6

– 0.5

– 8

Collection fees

5.8

5.7

0.1

2

Postage and stationery

9.3

8.6

0.7

8

Rental expense under operating leases

4.7

6.0

– 1.3

– 22

Information technology

23.6

24.1

– 0.5

– 2

Depreciation and amortisation

8.7

7.8

0.9

11

Other

1.6

– 0.7

– 0.9

117

Total

68.0

67.1

0.9

1


The Group’s general and administrative expenses increased by CHF 0.9 million, or 1%, from CHF 67.1 million to CHF 68.0 million in the year of 2017. Costs from professional services of CHF 11.4 million increased by 27%, or CHF 2.4 million, due to business development and continued focus on the simplification agenda and regulatory requirements. Marketing expenses were 8% or CHF 0.5 million lower in 2017 as there was a large-scale advertising campaign in 2016. Collection costs increased slightly by 2%, or CHF 0.1 million, to CHF 5.8 million. Costs for postage and stationery increased by 8%, or CHF 0.7 million, to CHF 9.3 million mainly due to growth in credit cards and additional costs driven by the acquisition of Swissbilling. The decrease in rental expenses by 22%, or CHF 1.3 million, to CHF 4.7 million related to the closure of branches in 2016 and lower headquarter rental costs in 2017. Information technology costs of CHF 23.6 million were 2% lower driven by the timing of IT investments and a one-off project related benefit in 2017. Depreciation and amortisation were higher due to costs related to the acquisition of Swissbilling and IT investments. Other included non-recurring costs of CHF 0.6 million in the first half-year of 2016.

The cost / income ratio was 42.4% in 2017 compared to 42.5% in 2016.

Income Tax Expense

For the years ended 31 December (CHF in millions)

2017

2016

Variance

in %

Income tax expense

38.8

38.2

0.6

2


The Group’s effective tax rate in both 2017 and 2016 was approximately 21%, which is in line with the statutory tax rate resulting from the combination of federal, cantonal and communal corporation taxes in Switzerland. The Group’s income tax expense increased by CHF 0.6 million, from CHF 38.2 million in 2016 to CHF 38.8 million in 2017, as a result of the 1% higher income before taxes.

The numbers published in the tables above are rounded in Swiss francs, therefore rounding differences can occur.

Outlook

Outlook and Guidance for 2018

Assuming no major change in the current economic environment, the Group is expecting earnings per share between CHF 4.80 and CHF 5.10 for the financial year 2018. Additional revenues from the recent acquisitions and the ongoing growth of the credit cards business are expected to offset the impact of the rate cap on interest income in the personal loans business. Operating expenses are expected to increase driven by higher headcount and further investment in the digitalisation of the business, translating into a healthy but slightly higher cost / income ratio. Loss performance is expected to be in line with prior years.

Financial Targets

The Group’s financial mid-term targets are as follows:

  • Net customer loan growth in line with Swiss GDP growth;
  • Average return on shareholders’ equity (ROE) of at least 15%;
  • Consolidated CET 1 capital ratio of minimum 18%; and
  • Ordinary dividend payout ratio between 60% and 70% of net income.